Part 1A: Express Area Under a Curve in Closed Form
Let a and b be two real numbers, where b > 0. Your goal is to find the area of the region on the xy-plane between the curve y = f(x) and the line y = 0, where \(f(x) = \exp \left( -\frac{1}{2} \left( \frac{x - a}{b} \right)^2 \right)\). The answer for this problem is a closed form formula that expresses the area as a function of the parameters a and b.
Insert your answer here.
Part 1B: Evaluate Three Integrals in Closed Form
Express the values of the three integrals shown below in closed form.
| \[\int_{-\infty}^{\infty} \frac{\exp(- (x - \mu)/s)}{\left(1 + \exp(-(x - \mu)/s) \right)^2} \, \mathrm{d} \kern1pt x = \quad ?\] In this formula, \(\mu\) is a real number and \(s\) is a positive real number. |
Insert your answer here. |
| \[\int_{\infty}^{\infty} \int_{0}^{\infty} \exp(-t) \cos \left( t \left( \frac{x - \mu}{c} \right) + \frac{2 t}{\pi} \log \left( \frac{t}{c} \right) \right) \, \mathrm{d} \kern1pt t \, \mathrm{d} \kern1pt x = \quad ? \] In this forumla, \(\mu\) is a real number and \(c\) is a positive real number. |
Insert your answer here. |
| \[\int_{\infty}^{\infty} \frac{e^{- \frac{c}{2(x - \mu)}}}{(x - \mu)^{\frac{3}{2}}} \mathrm{d} \kern1pt x = \quad ? \] Here \(\mu\) is a real number and \(c\) is a positive real number. |
Insert your answer here. |
Hint: this problem can be solved without integration in a way that is similar to Part 1A by looking at the logistic distribution, the Landau distribution, and the Lévy distribution. Recall that the integral of a probability density function (pdf) over the entire space is equal to 1. It is also worth remembering that integration is a linear mapping. In particular, this implies that multiplying the integrand by a constant is equivalent to multiplying the value of the whole integral by the same constant.
Part 2: How many dimensions are used in Lloyd's paper?
In the paper by Lloyd (1957, 1982) (the document is also available in Canvas), Section VI (Quantization Process) describes a special case of what later became known as the k-means algorithm. This special case is for a space with how many dimensions? 1D, 2D, 3D, or more? Explain why.
Insert your answer here.
Part 3A: Cluster 'Old Faithful' Dataset Using K-Means
Run the k-means clustering on the 'Old Faithful' eruptions dataset with k=2 (i.e., for two clusters). The dataset is available in the course-provided virtual machine (VM). Visualize your clusters using a scatter plot and insert it in the space below. Your plot should have relatively clear separation between the two clusters with only a few seemingly incorrectly assigned points. Also, provide a CSV or Excel file with the cluster labels for each data point from which your plot was built. An example greyscale clustering plot that should be similar to your results is included. Preferably, your plot should appear in full color.

|
 Insert your plot to replace the placeholder above.
 |
Part 3B: Cluster 'Old Faithful' Dataset Using Gaussian Mixtures
Run the EM algorithm for Gaussian Mixtures to cluster the 'Old Faithful' dataset with two components and full covariances. Visualize your clusters using a scatter plot and insert it in the space below. Your plot should have very good separation between the two clusters with very few seemingly incorrectly assigned points (hint: you may need to use smaller convergence tolerance or larger number of iterations to achieve very good separation). Also, provide a CSV or Excel file with the cluster labels for each data point from which your plot was built. An example greyscale clustering plot that should be similar to your results is included. Preferably, your plot should appear in full color.

|
 Insert your plot to replace the placeholder above.
 |
Part 3C: Visualize Mixture Components from Part 3B
Visualize the two gaussian mixture components computed by the EM algorithm in part 3b by indicating their means and the eigenvectors of their covariance matrices on a plot. One possibility is to draw two line segments that correspond to the eigenvectors so that they intersect at the mean for each of the two mixture components. This approach is used in the example plot shown below. Feel free to explore other approaches for visualization. Also, provide an Excel file that was used to generate the plot (or a description of your approach that is sufficient to reproduce the results if you didn't use Excel).

|
 Insert your plot to replace the placeholder above.
 |
Part 4: Cluster Pixels in Example Image from Wikipedia
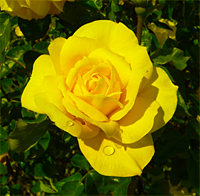
In this problem your goal is to reproduce the clustering of the example image (Rosa_Gold_Glow_2_small_noblue.png, provided in the table below). In this image the color information is present only in the red and green channels. This example originates from Wikipedia.
First, update the course app in the VM to version 0.9.8 or later using the 'Update App' desktop shortcut. Second, convert the image to CSV using the 'Images to CSV' tool in the app. Third, cluster the resulting CSV file into 16 clusters using k-means. Finally, visualize the coordinates of the cluster centroids using a scatter plot (e.g., in Excel) and replace placeholder image below with an image generated using this plot. Preferably, your plot should appear in full color. Also include your CSV or Excel file with the coordinates of the centroids as a part of your solution.
Input image with red and green channels:
|
Example scatter plot in grayscale:
|
Insert your scatter plot here:
|
Part 5A: Analysis of Roman Dice
Suppose that you've found a pair of dice in a museum that originates from this set of Roman dice. In this problem, your goal is to determine the probability distribution of the number of dots on the front faces associated with rolling these or other unfair dice. The following table gives the probability distributions of the front faces for each of the two dice.
.jpg)
| ⚀ | ⚁ | ⚂ | ⚃ | ⚄ | ⚅ | |
| Dice 1 | 0.15 | 0.17 | 0.21 | 0.15 | 0.15 | 0.17 |
| Dice 2 | 0.17 | 0.17 | 0.14 | 0.13 | 0.19 | 0.20 |
Insert the probability distribution of the number of dots on the front faces these two dice if they are rolled simultaneously in the table below. Also, describe how you would solve the problem if you had to analyze the probability distribution of the number of dots on the front faces observed after rolling N such dice, provided that the distribution of front faces is known for each of them?
| 2 | 3 | 4 | 5 | 6 | 7 | 8 | 9 | 10 | 11 | 12 |
| ? | ? | ? | ? | ? | ? | ? | ? | ? | ? | ? |
Insert your text here.
Part 5B: Analysis of Roman Dice and Greek Coin
Suppose that in addition to tossing the two Roman dice from Part 5A, you also decided to toss this Greek coin 5 times. After careful measurements, it appears that this coin shows heads with probability 0.55 and tails with probability 0.45. What is, then, the probability distribution of the random variable defined as the sum of the number of dots on the front faces of the two dice and the number of times that the coin shows heads?
| 2 | 3 | 4 | 5 | 6 | 7 | 8 | 9 | 10 | 11 | 12 | 13 | 14 | 15 | 16 | 17 |
| ? | ? | ? | ? | ? | ? | ? | ? | ? | ? | ? | ? | ? | ? | ? | ? |
Part 6 (Extra Credit): K-Means++ Versus K-Means
Explain the relationship between k-means++ and k-means. What are the advantages of using k-means++? What are some of the possible disadvantages? What alternatives are there for k-means++ (include references in your response)?
Insert your answer here.
[HCI Implementation, Optional]
Part 7: Compare K-Means and K-Means++
Using the implementation used by the course app, or any other implementation, e.g., your own implementation, evaluate the k-means++ algorithm. Compare k-means++ with standard k-means using the definitions used in the k-means++ paper. See if you can reproduce the middle column shown in Table 3 of the k-means++ paper on the 1st subset of the Cloud dataset (1024 points in 10 dimensions). If there are substantial differences between your results and what the paper lists, then describe them. If you used the app, then include the screenshots that correspond to the table entries and also the CSV file that you used as the input. If you used your own implementation, then provide its source code and a brief description of how the results were obtained.
| Minimum \(\phi\) | ||
| k | k-means | k-means++ |
| 10 | ? | ? |
| 25 | ? | ? |
| 50 | ? | ? |
Insert your text here.